Domino
Extracting, Comparing, and Manipulating Subsets
across Multiple Tabular Datasets


| artist | origin | career status | gender | first album | studio albums |
|---|---|---|---|---|---|
| Rihanna | Barbados | active | female | 2005 | 7 |
| Britney Spears | US | active | female | 1999 | 8 |
| Whitney Houston | US | inactive | female | 1985 | 7 |
| Eminem | US | active | male | 1996 | 8 |
| Elton John | UK | active | male | 1969 | 33 |
| Elvis Presley | US | inactive | male | 1956 | 25 |
| The Beatles | UK | inactive | group | 1963 | 12 |
| U2 | Ireland | active | group | 1980 | 12 |
| ABBA | Sweden | inactive | group | 1973 | 8 |
Related Work
Flexible Linked Axes for Multi-variate Data Visualization
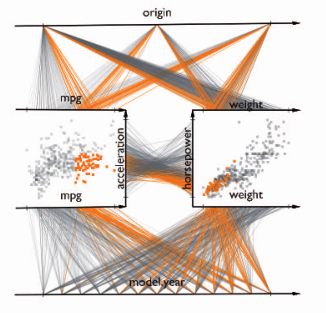
[Claessen and van Wijk, 2011]
Connected Charts: Explicit Visualization of Relationships between Data Graphics
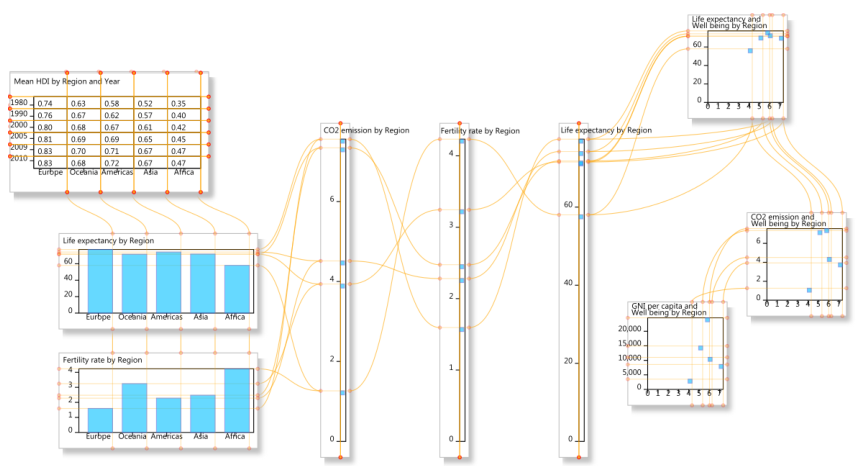
[Viau and McGuffin, 2012]
| artist | origin | career status | gender | first album | studio albums |
|---|---|---|---|---|---|
| Rihanna | Barbados | active | female | 2005 | 7 |
| Britney Spears | US | active | female | 1999 | 8 |
| Whitney Houston | US | inactive | female | 1985 | 7 |
| Eminem | US | active | male | 1996 | 8 |
| Elton John | UK | active | male | 1969 | 33 |
| Elvis Presley | US | inactive | male | 1956 | 25 |
| The Beatles | UK | inactive | group | 1963 | 12 |
| U2 | Ireland | active | group | 1980 | 12 |
| ABBA | Sweden | inactive | group | 1973 | 8 |
| market | continent | sold singles | sold albums | retailvalue | population |
|---|---|---|---|---|---|
| US | North America | 1.5M | 225.8M | 3635.2M$ | 310.2M |
| Germany | Europe | 6.8M | 98.7M | 1713.6M$ | 82.3M |
| UK | Europe | 2.4M | 99.8M | 1388.1M$ | 62.3M |
| Australia | Australia | 0.0M | 24.5M | 408.0M$ | 21.5M |
| Canada | North America | 0.2M | 25.9M | 343.2M$ | 33.7M |
| Netherlands | Europe | 0.5M | 16.7M | 270.2M$ | 16.8M |
| Austria | Europe | 0.1M | 7.5M | 184.1M$ | 8.2M |
| Sweden | Europe | 0.1M | 13.7M | 136.8M$ | 9.1M |
| Ireland | Europe | 0.2M | 4.9M | 77.9M$ | 4.4M |
Domino
Analyse multiple tabular datasets by
subsets
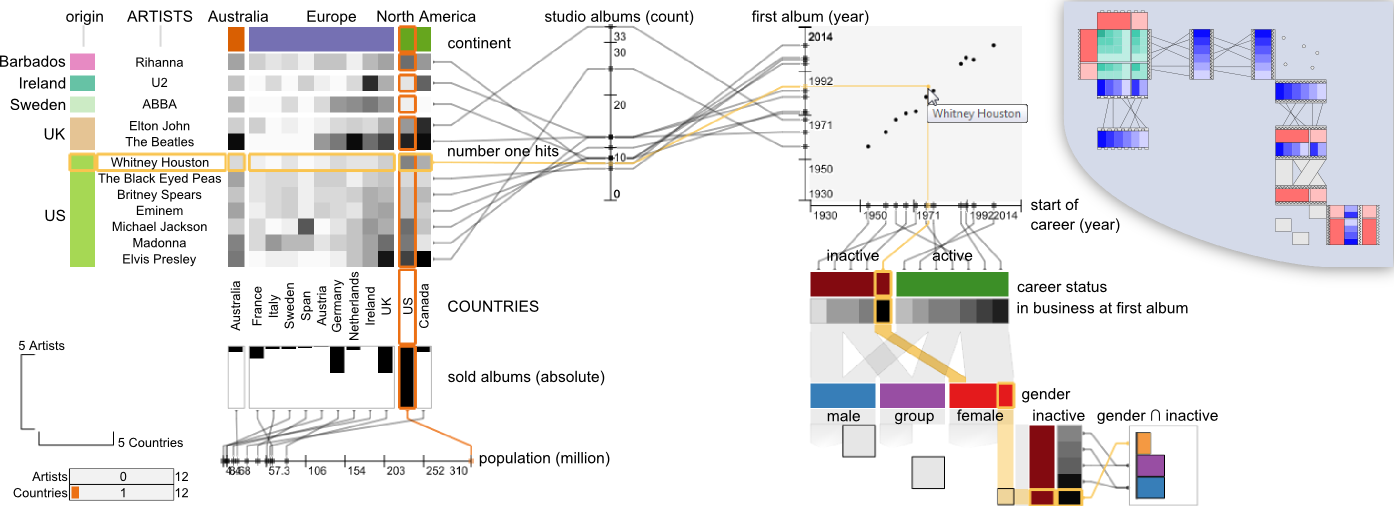
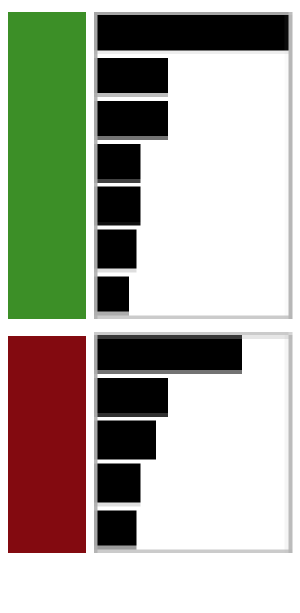
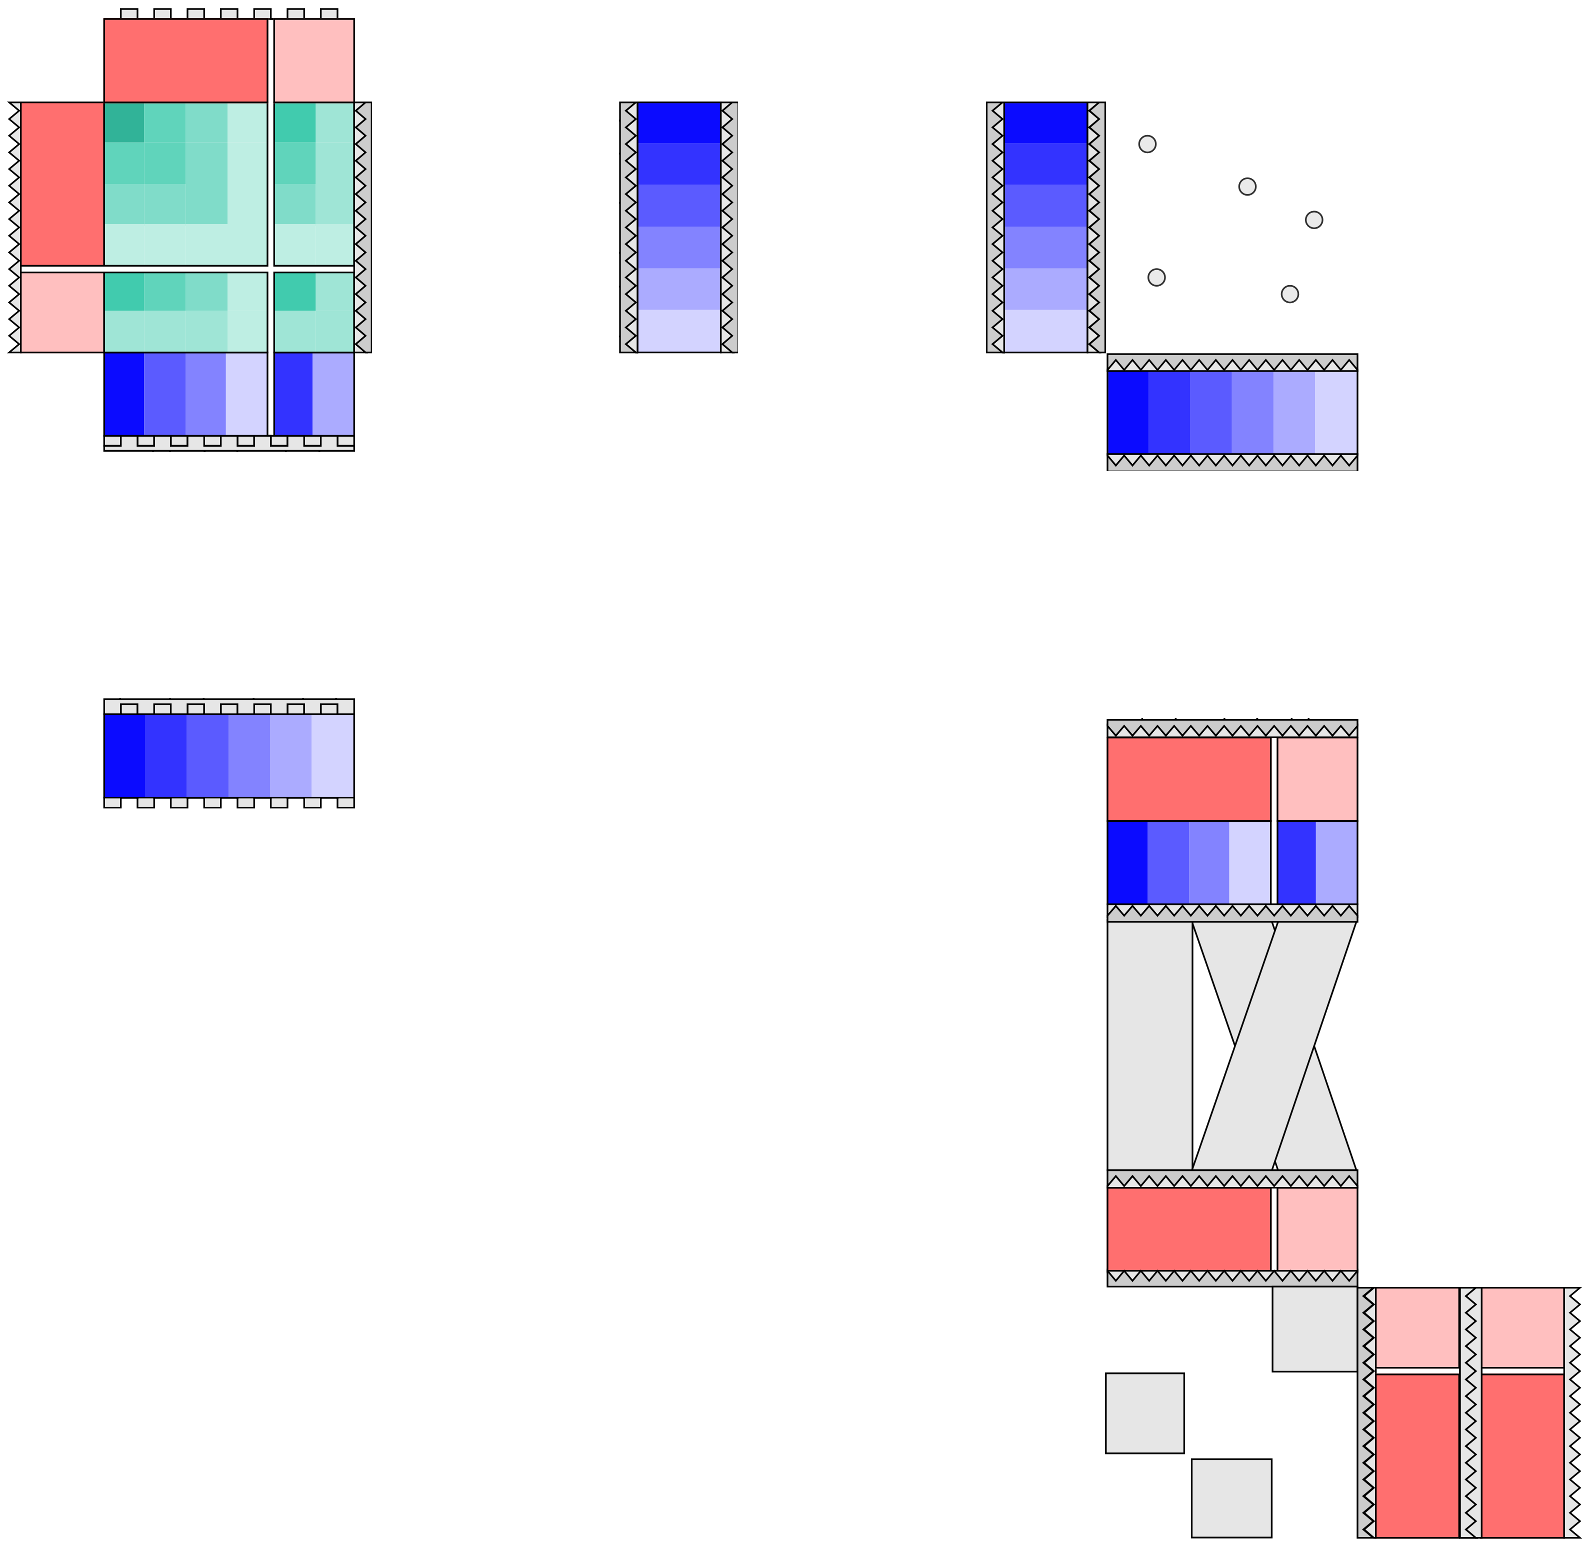
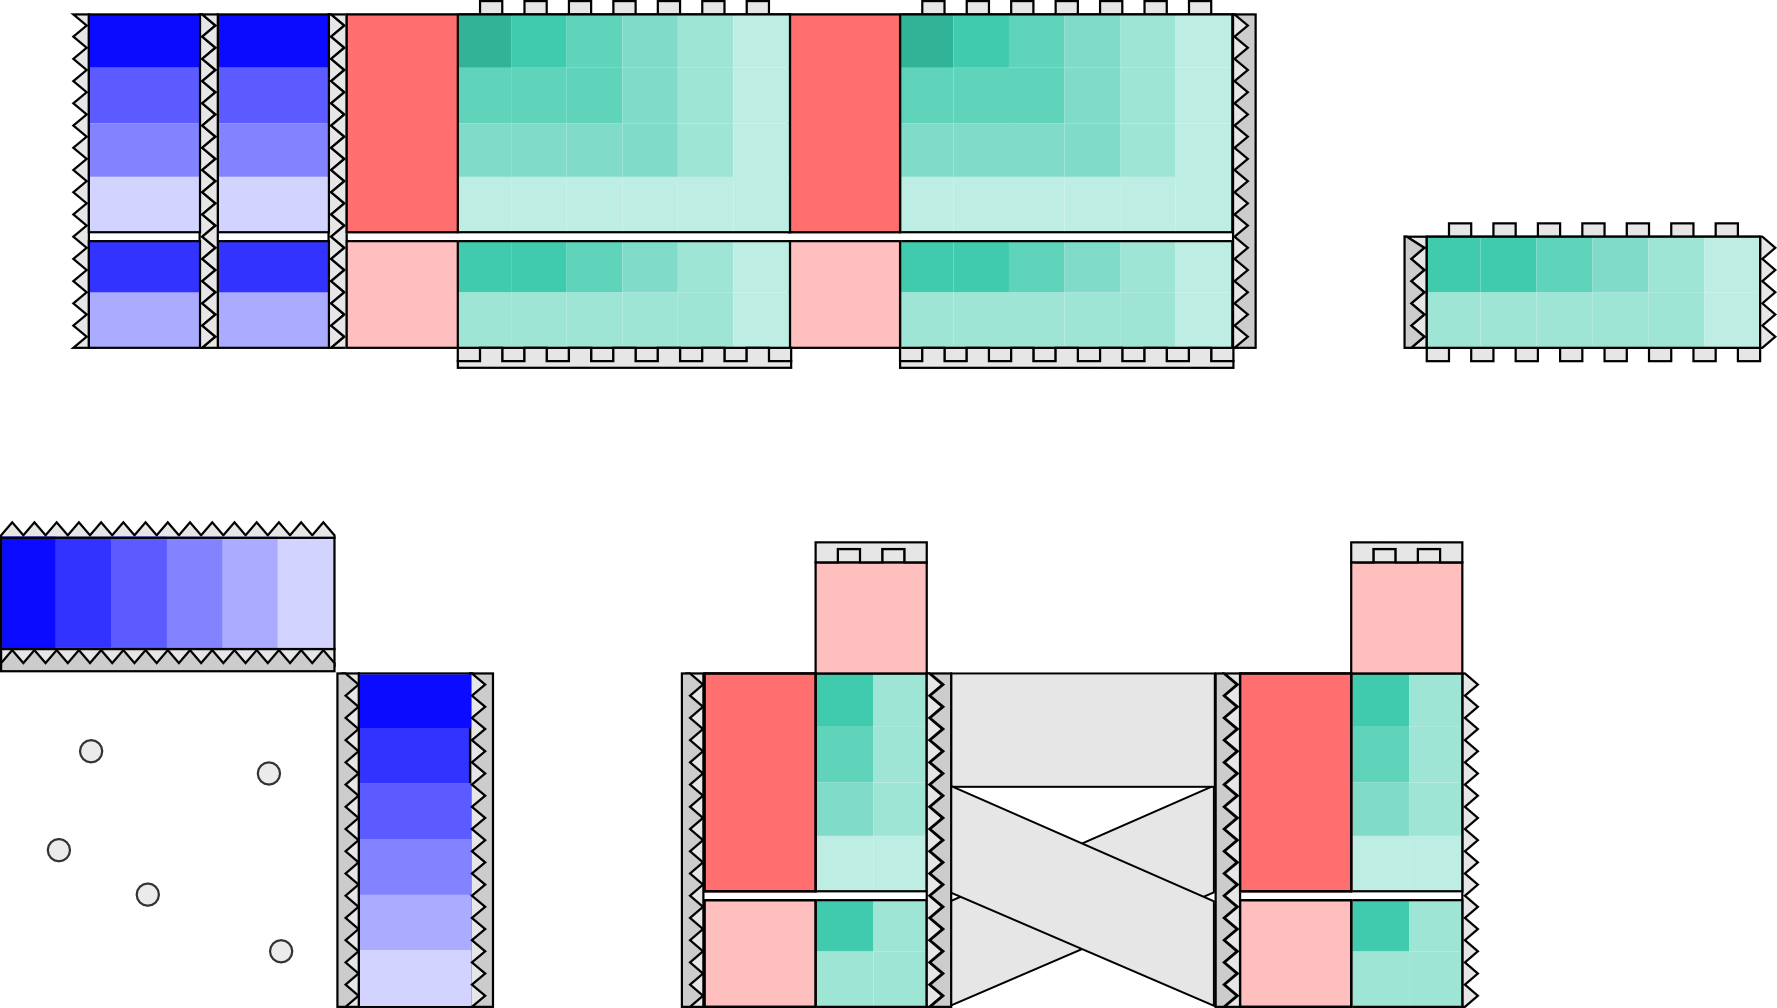
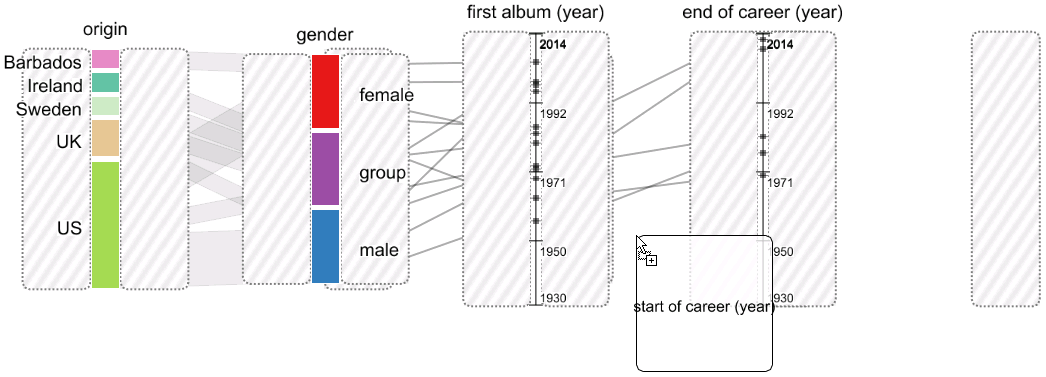
Domino Visualization Technique
basic elements:
- blocks and their
- relationships
representing:
- subsets
- associated data
- and relationships between
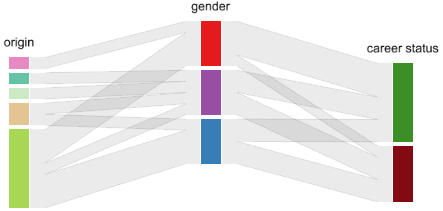
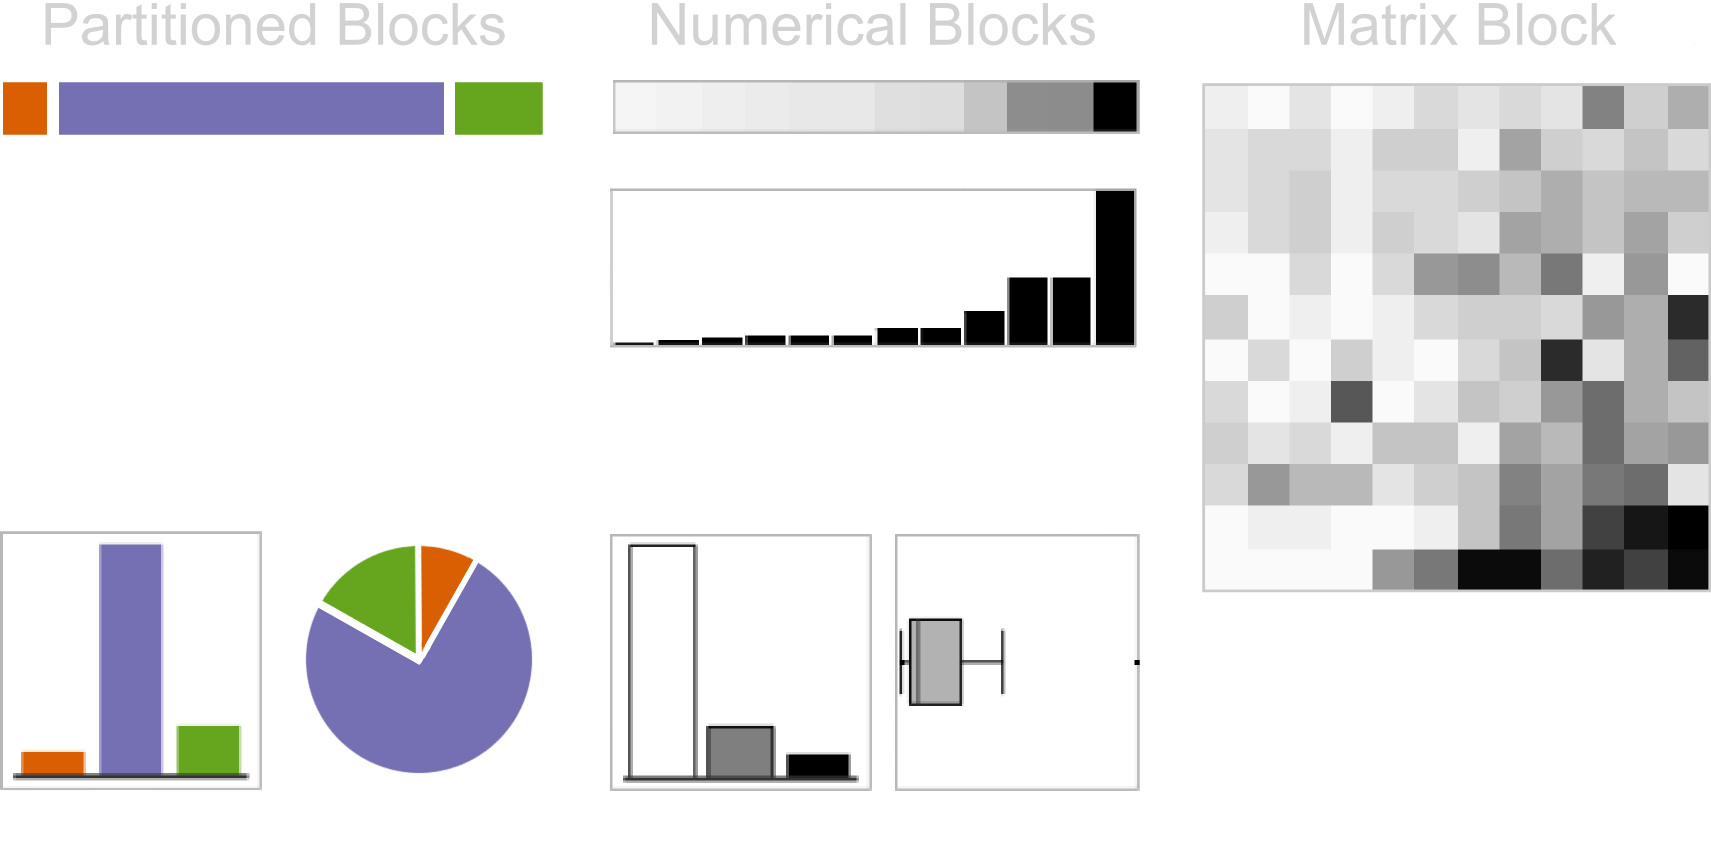
Block Types
- gender
- origin
- continent
- age
- album count
- population
- # of #1 hits
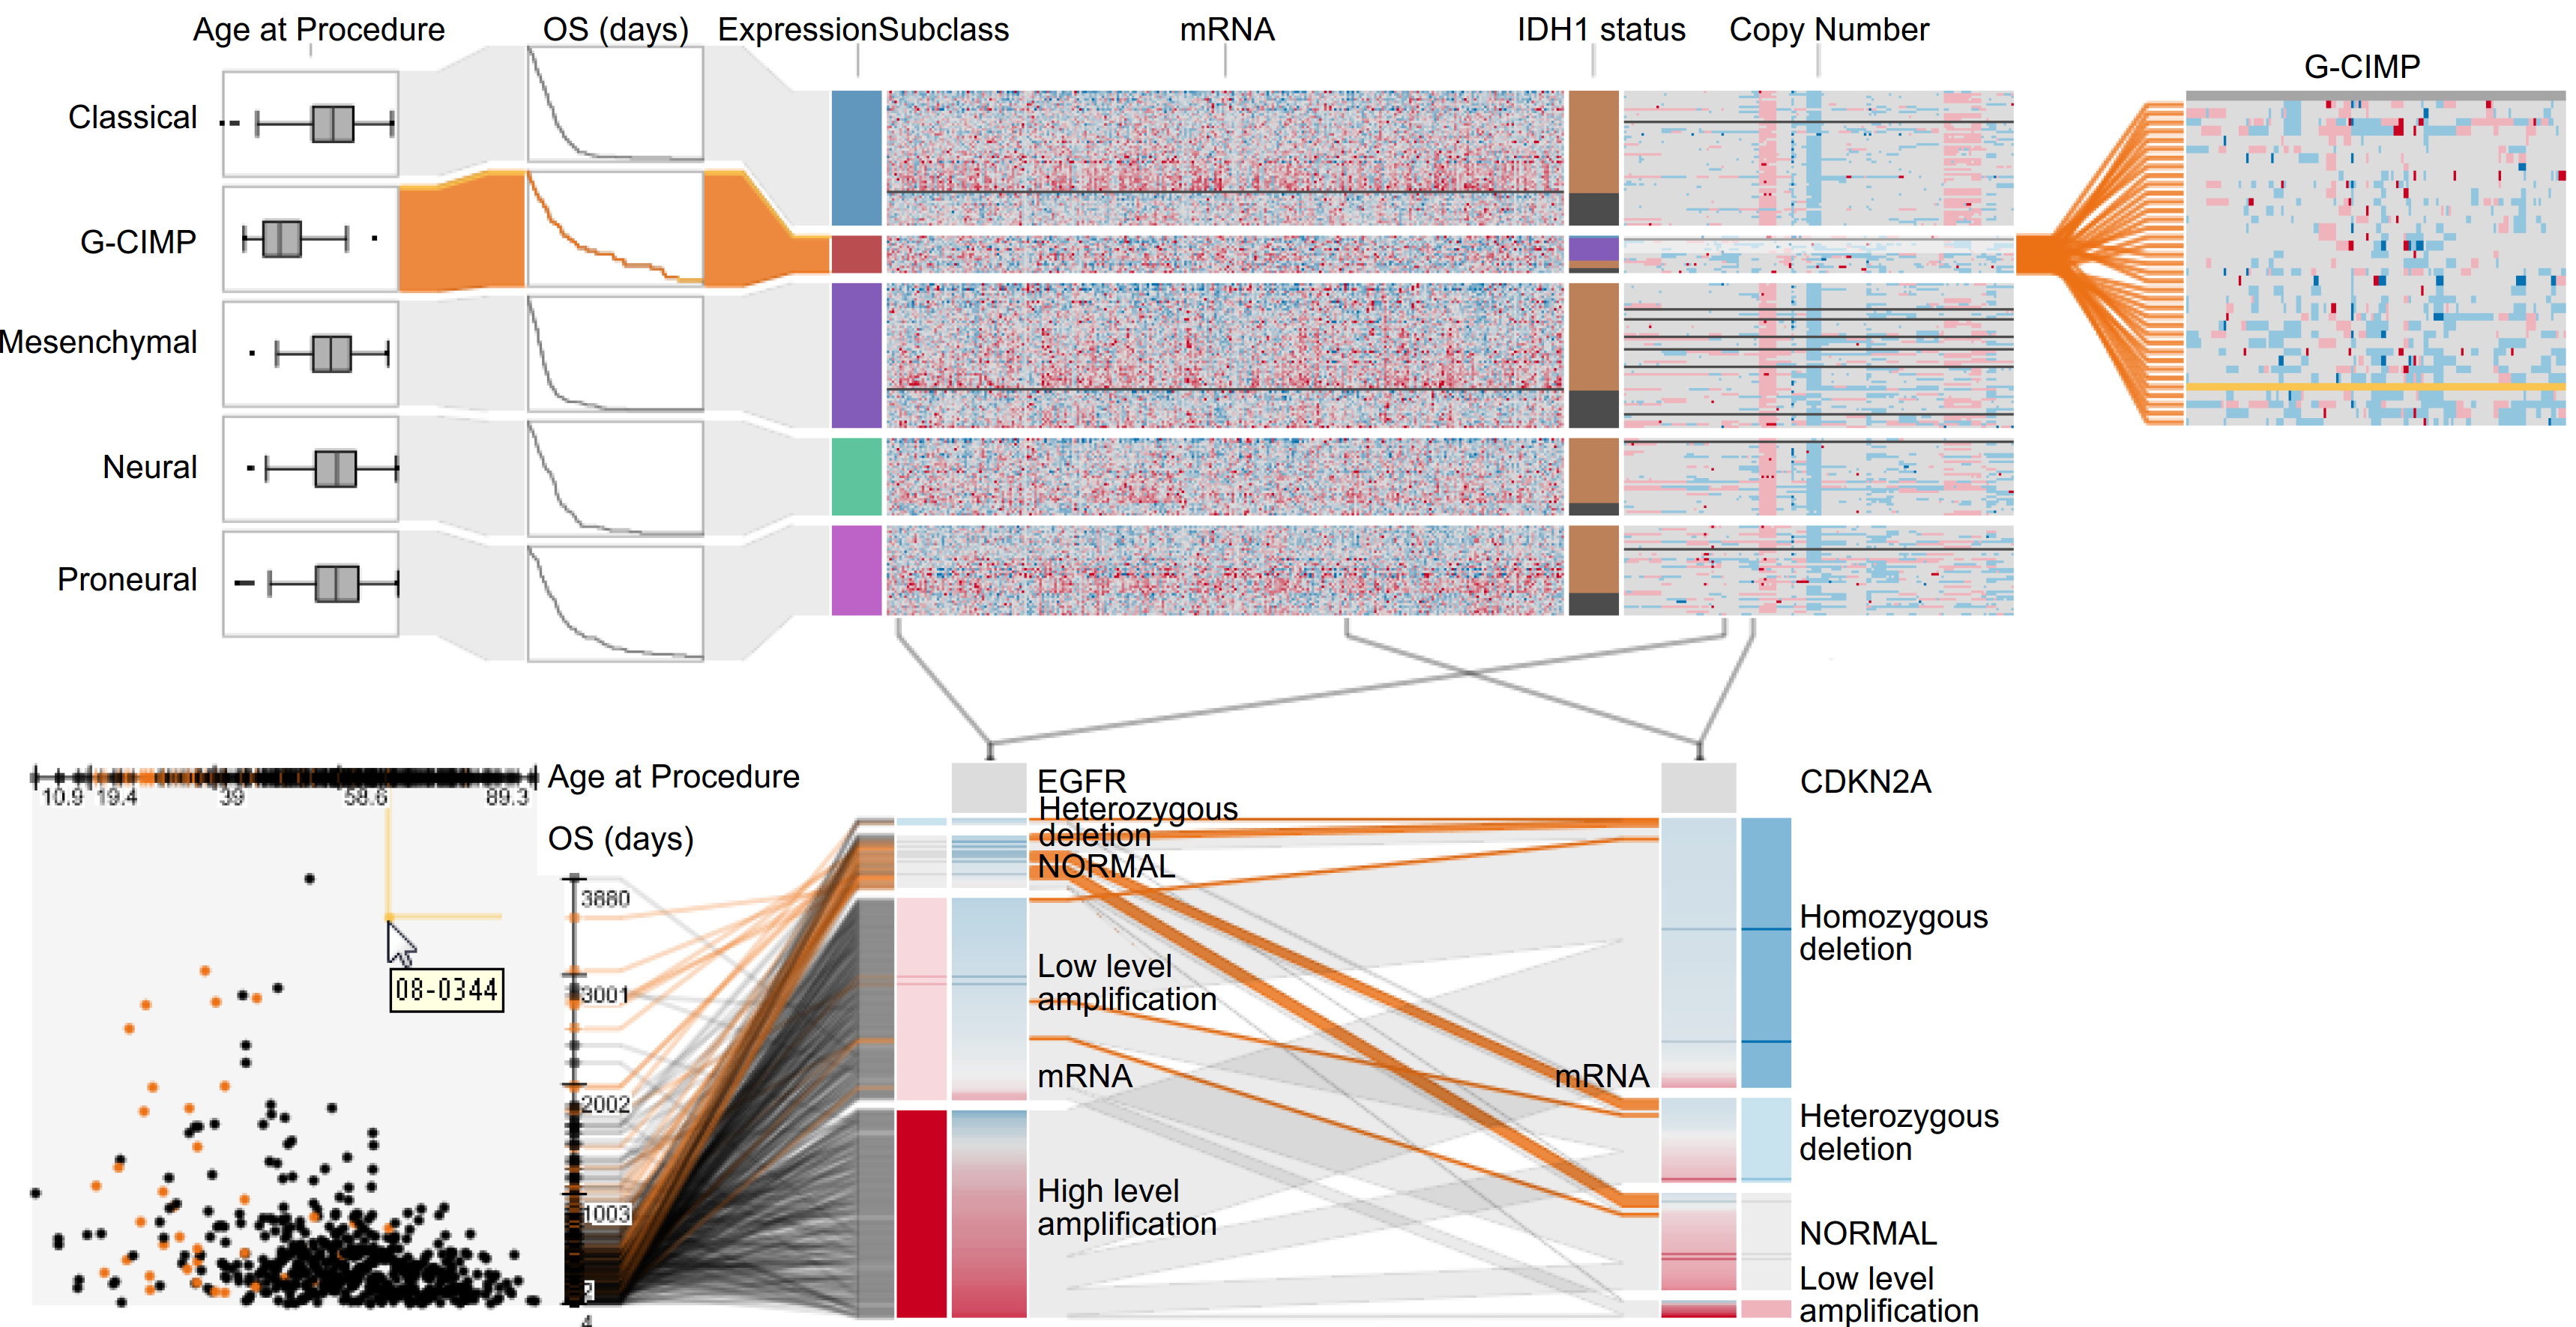
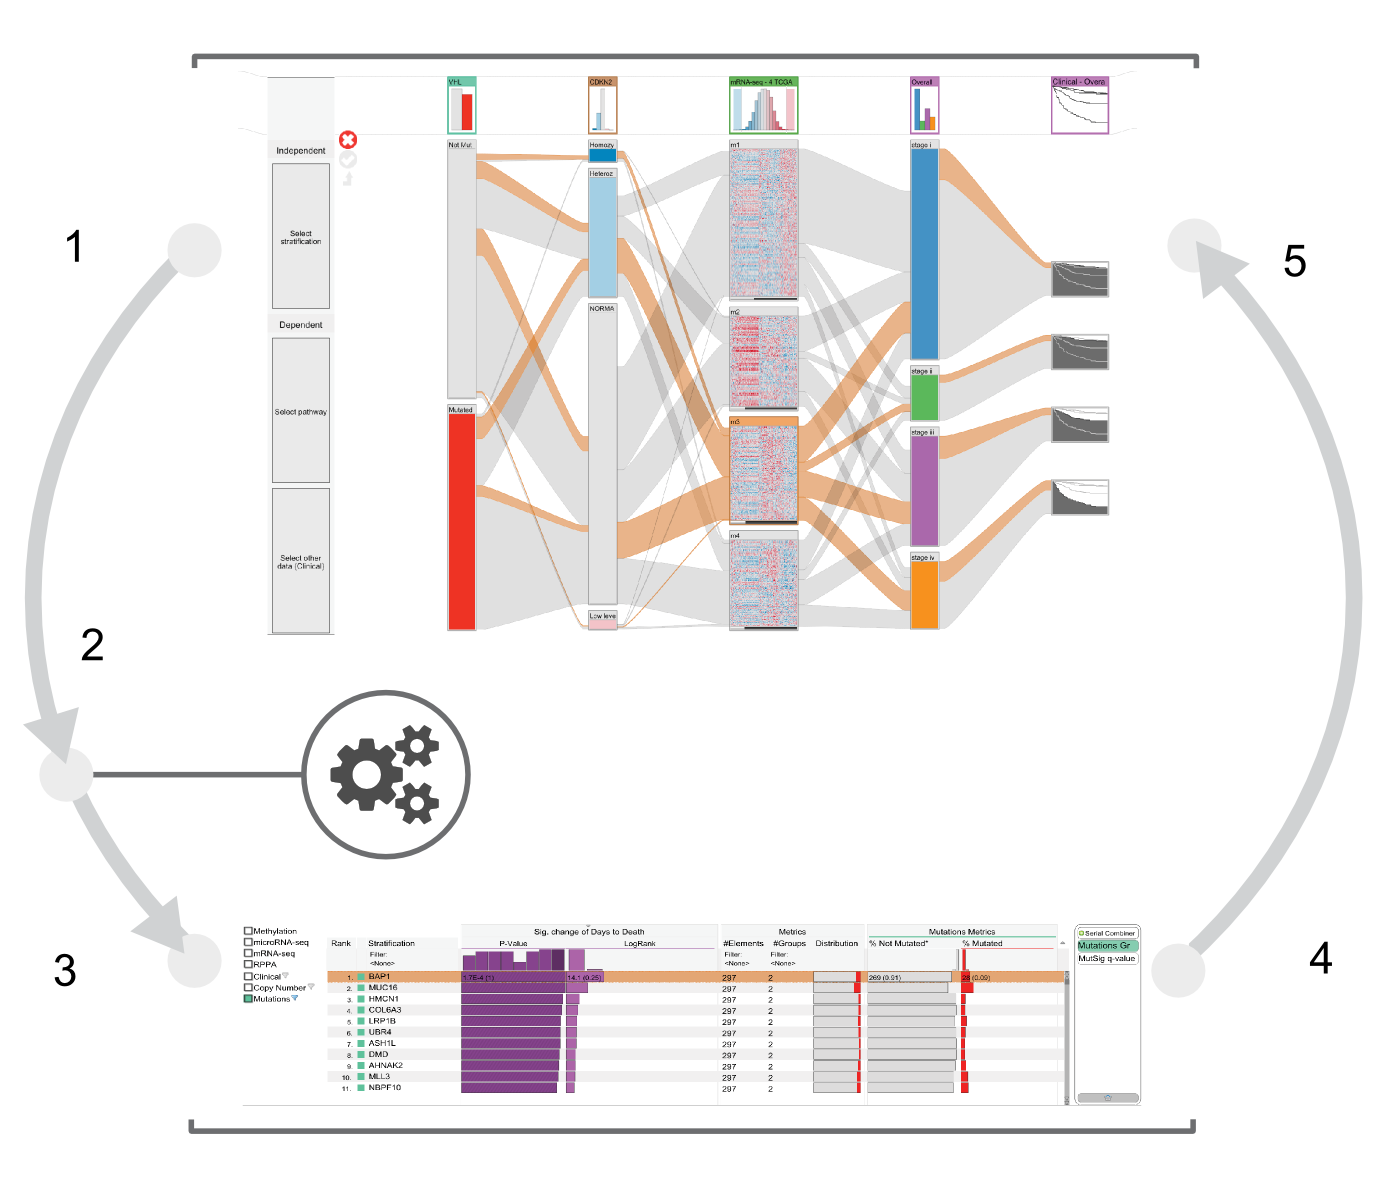
Multiform Visualization
[Lex et al., 2011]
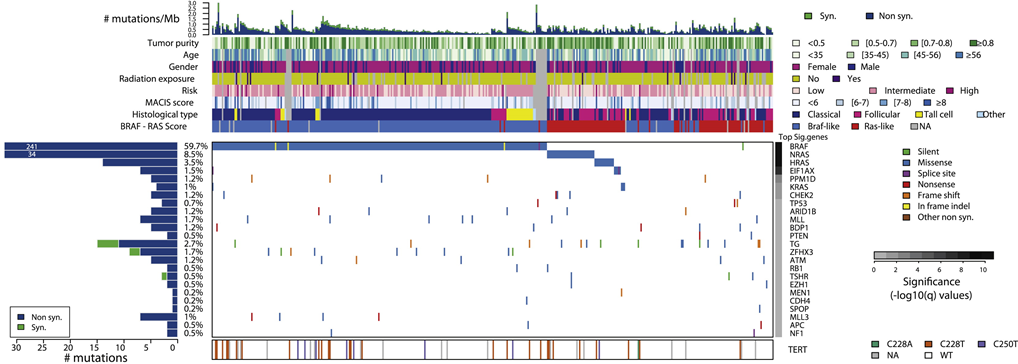
[The Cancer Genome Atlas Research Network et al., 2014]
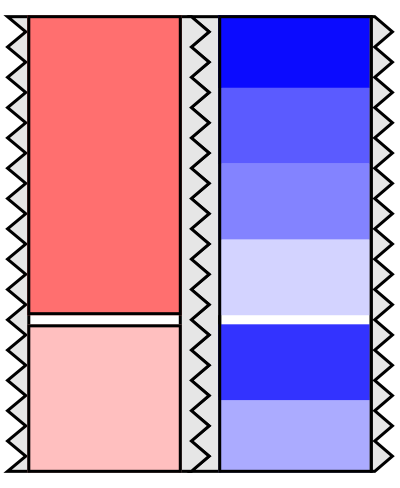
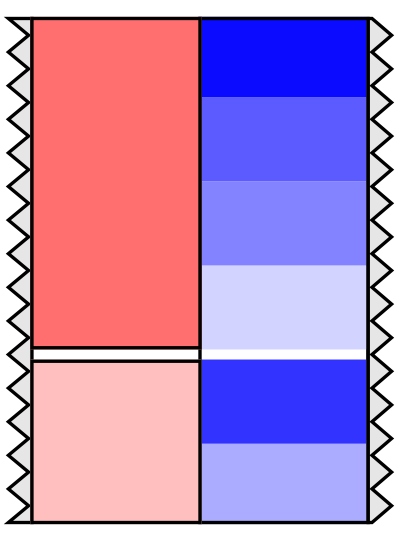
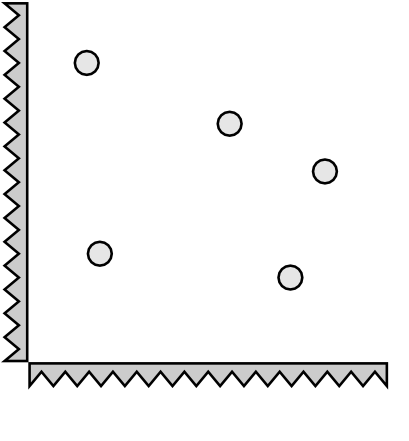
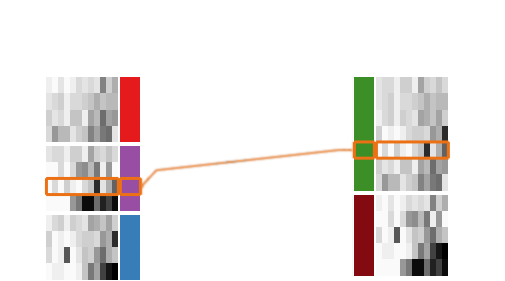
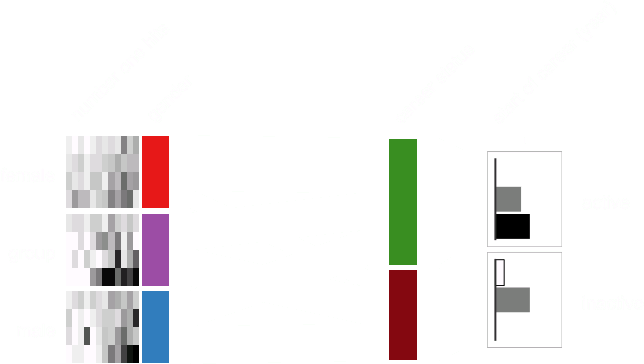
Relationships
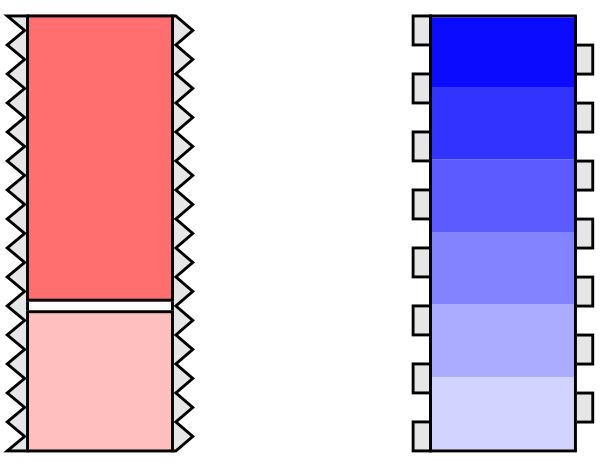

- <nothing>
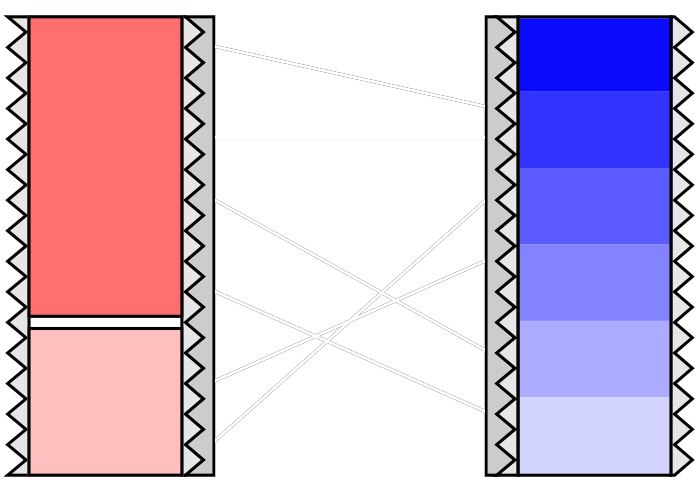

- shared item type

- shared item type
- shared partitioning
- shared item type
- shared partitioning
- shared sorting
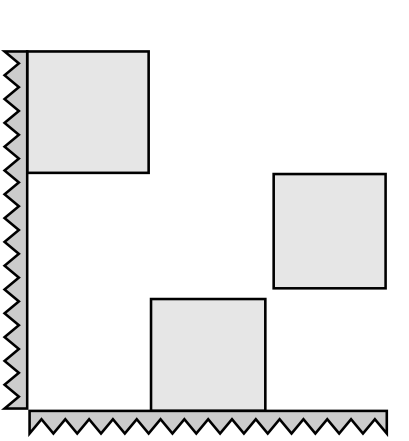
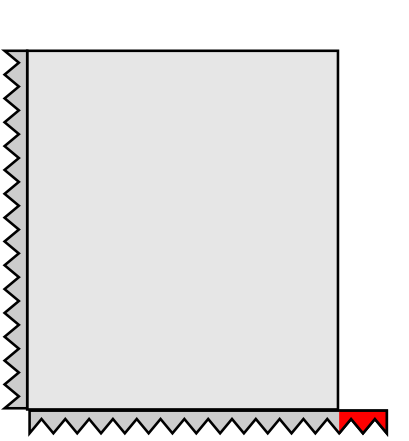
Relationships Representation
| item | group | block | ||
|---|---|---|---|---|
| granularity | ||||
| direction | parallel |

|

|

|
| orthogonal |
|
|
|
|


[Inselberg, 1985]
[Claessen and van Wijk, 2011]
[Viau and McGuffin, 2012]
[Kosara etal, 2006]
[Lex et al., 2010]
[Lex et al., 2012]


Open Source (BSD 3)
Source code:
https://github.com/caleydo
Demos, videos, and more:
http://domino.caleydo.org
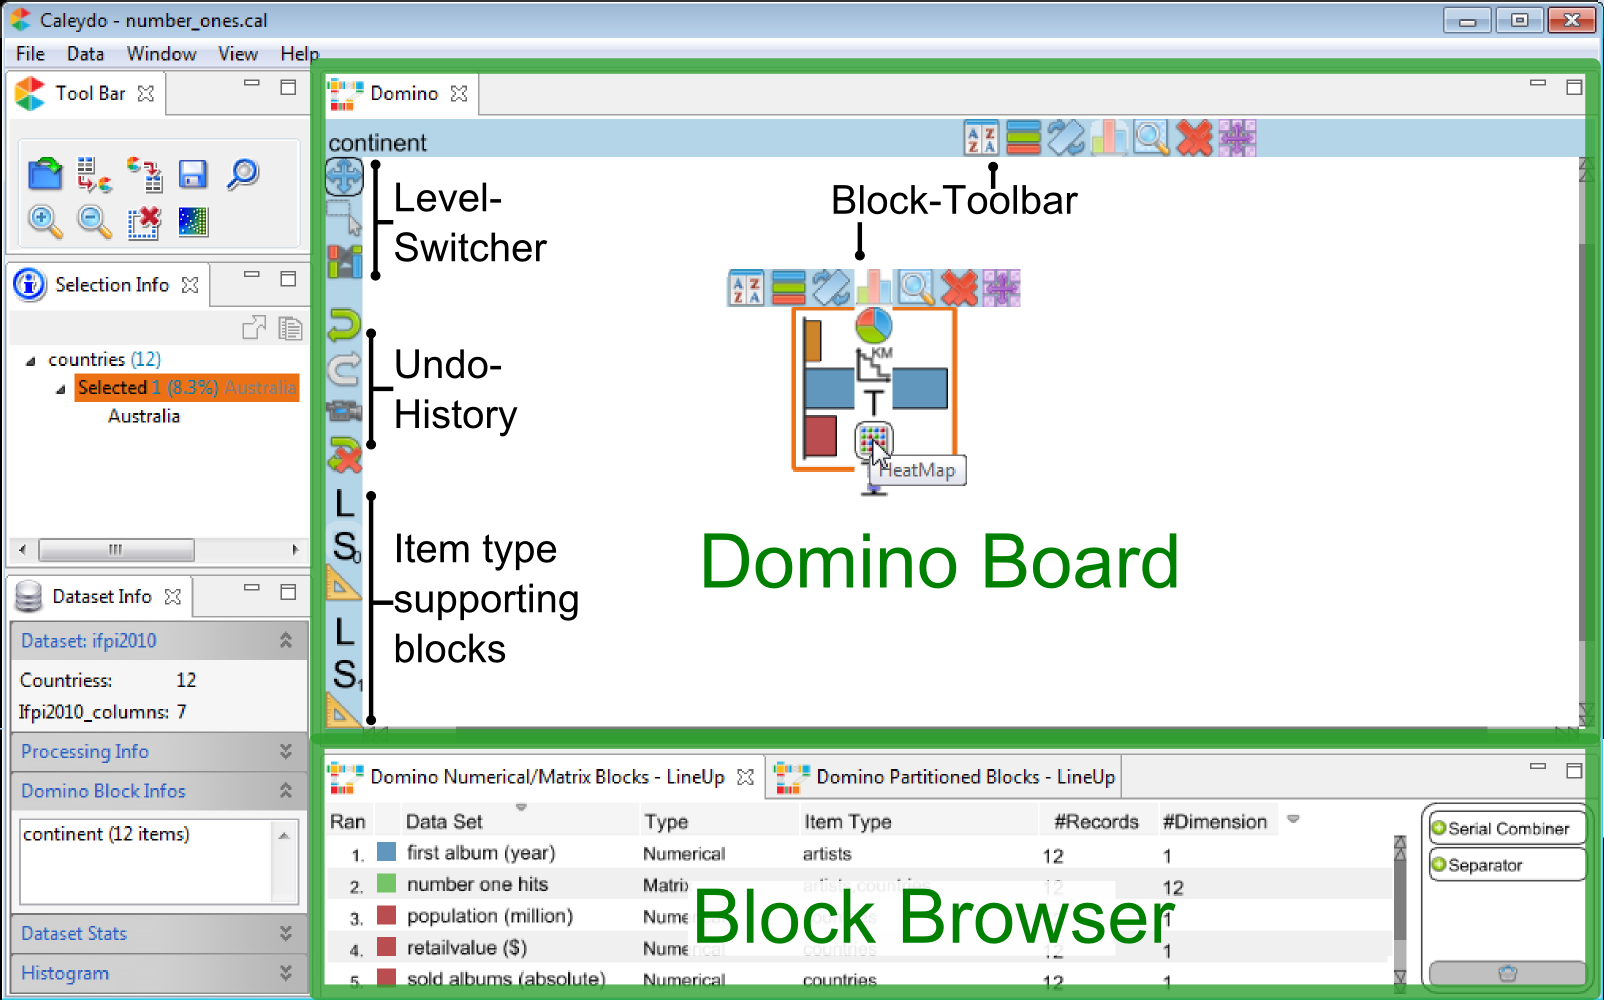
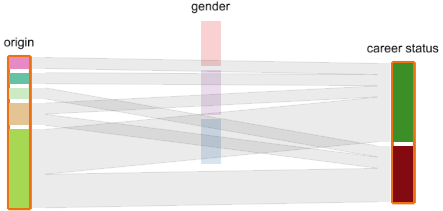
Placeholder + Live Previews
Selection and Highlighting
Subset Manipulation
Summary and Future Work
Domino is general visualization technique based on blocks and relationships for extracting, comparing and manipulating subsets.
Future Work
- Guidance
- Grammar
Guidance
[Streit et al., 2014]
Grammar


Domino Grammar
Domino
Extracting, Comparing, and Manipulating Subsets
across Multiple Tabular Datasets
Samuel Gratzl, Nils Gehlenborg, Alexander Lex, Hanspeter Pfister, and Marc Streit
References
- [Claessen and van Wijk, 2011] J. H. Claessen and J. J. van Wijk, “Flexible Linked Axes for Multivariate Data Visualization,” IEEE Transactions on Visualization and Computer Graphics (InfoVis ’11), vol. 17, no. 12, pp. 2310–2316, 2011.
- [Viau and McGuffin, 2012] C. Viau and M. J. McGuffin, “ConnectedCharts: Explicit Visualization of Relationships between Data Graphics,” Computer Graphics Forum, vol. 31, no. 3pt4, pp. 1285–1294, 2012.
- [The Cancer Genome Atlas Research Network et al., 2014] The Cancer Genome Atlas Research Network et al., “Integrated Genomic Characterization of Papillary Thyroid Carcinoma“, Cell 159, 676–690, 2014.
- [Inselberg, 1985] A. Inselberg, “The plane with parallel coordinates”, The Visual Computer 1, 69–91, 1985.
- [Kosara etal, 2006] R. Kosara, F. Bendix, and H. Hauser, “Parallel Sets: Interactive Exploration and Visual Analysis of Categorical Data,” IEEE Transactions on Visualization and Computer Graphics, vol. 12, no. 4, pp. 558–568, 2006.
- [Lex et al., 2010] A. Lex, M. Streit, C. Partl, K. Kashofer, and D. Schmalstieg, “Comparative Analysis of Multidimensional, Quantitative Data,” IEEE Transactions on Visualization and Computer Graphics (InfoVis ’10), vol. 16, no. 6, pp. 1027–1035, 2010.
- [Lex et al., 2011] A. Lex, M. Streit, H.-J. Schulz, C. Partl, D. Schmalstieg, 2011. VisBricks: Multiform Visualization of Large, Inhomogeneous Data. IEEE Transactions on Visualization and Computer Graphics (InfoVis ’11) 17, 2291–2300, 2011
- [Lex et al., 2012] A. Lex, M. Streit, H.-J. Schulz, C. Partl, D. Schmalstieg, P. J. Park, and N. Gehlenborg, “StratomeX: Visual Analysis of Large-Scale Heterogeneous Genomics Data for Cancer Subtype Characterization” Computer Graphics Forum (EuroVis ’12), vol. 31, no. 3, pp. 1175–1184, 2012.
- [Streit et al., 2014] M. Streit, A. Lex, S. Gratzl, C. Partl, D. Schmalstieg, H. Pfister, P.J. Park, N. Gehlenborg, “Guided visual exploration of genomic stratifications in cancer”. Nature Methods 11, 884–885, 2014.